How Fleet Sensors Capture Road Surface Quality Data
Sep 24, 2026 Resolute Dynamics
Every vehicle in a fleet drives the same roads day after day, which makes each one a rolling survey of the pavement it travels. With the right sensors, a vehicle measures road roughness and spots potholes as it goes, and a fleet turns thousands of ordinary trips into a live map of road condition.
The main measure of that condition is the International Roughness Index, or IRI, which scores how rough a stretch of road is. This guide covers what a vehicle can capture, the sensors that do it, how raw motion becomes a usable reading, and what a fleet does with the result.
What Road Surface Data a Vehicle Can Capture
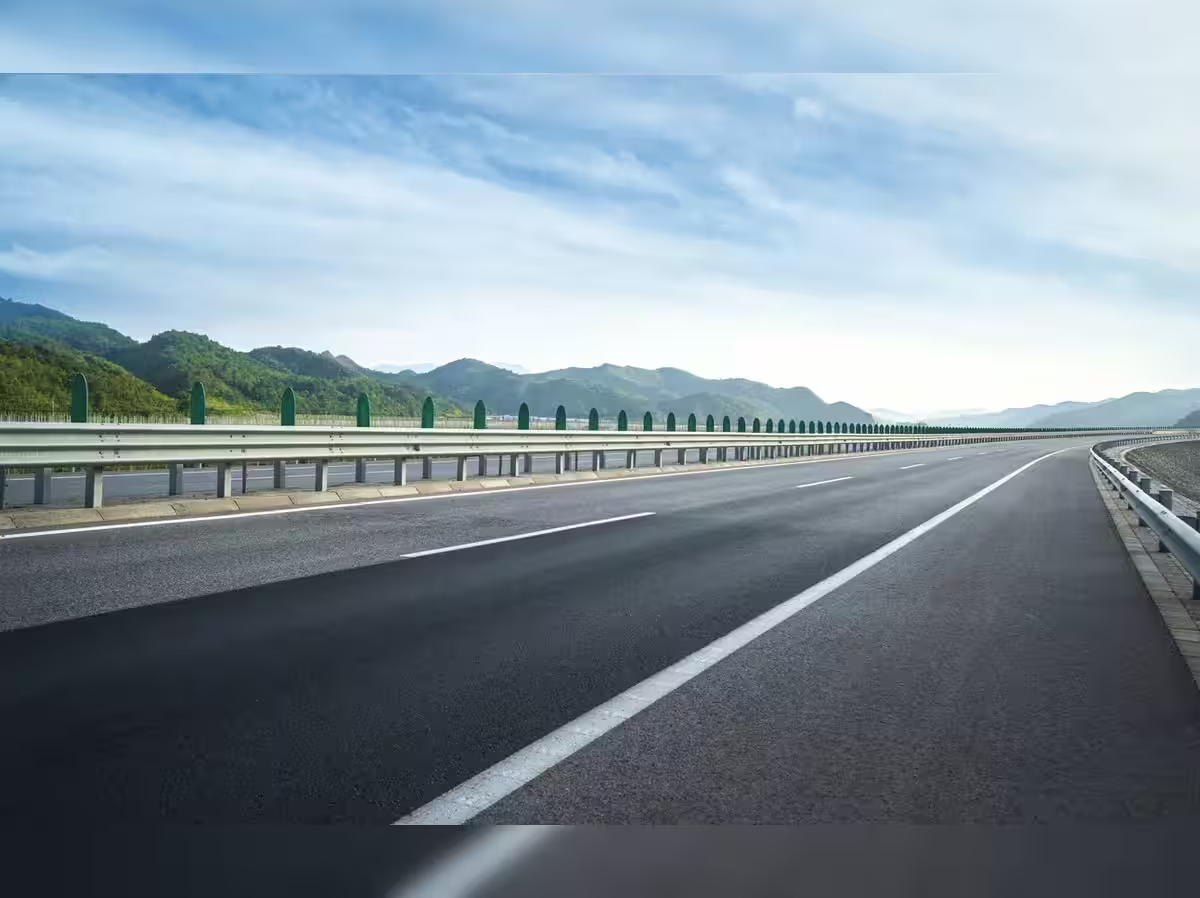
A moving vehicle can capture three things: overall road roughness, individual defects like potholes, and the exact location of each. Together they describe both the general state of a road and the specific hazards on it.
Road Roughness, Scored as IRI
Roughness is captured as the International Roughness Index, which accumulates the vertical movement measured along a road segment. IRI is reported in metres per kilometre, and a lower number means a smoother road. It gives a fleet one consistent score to compare one stretch of road against another.
Potholes, Bumps, and Cracks
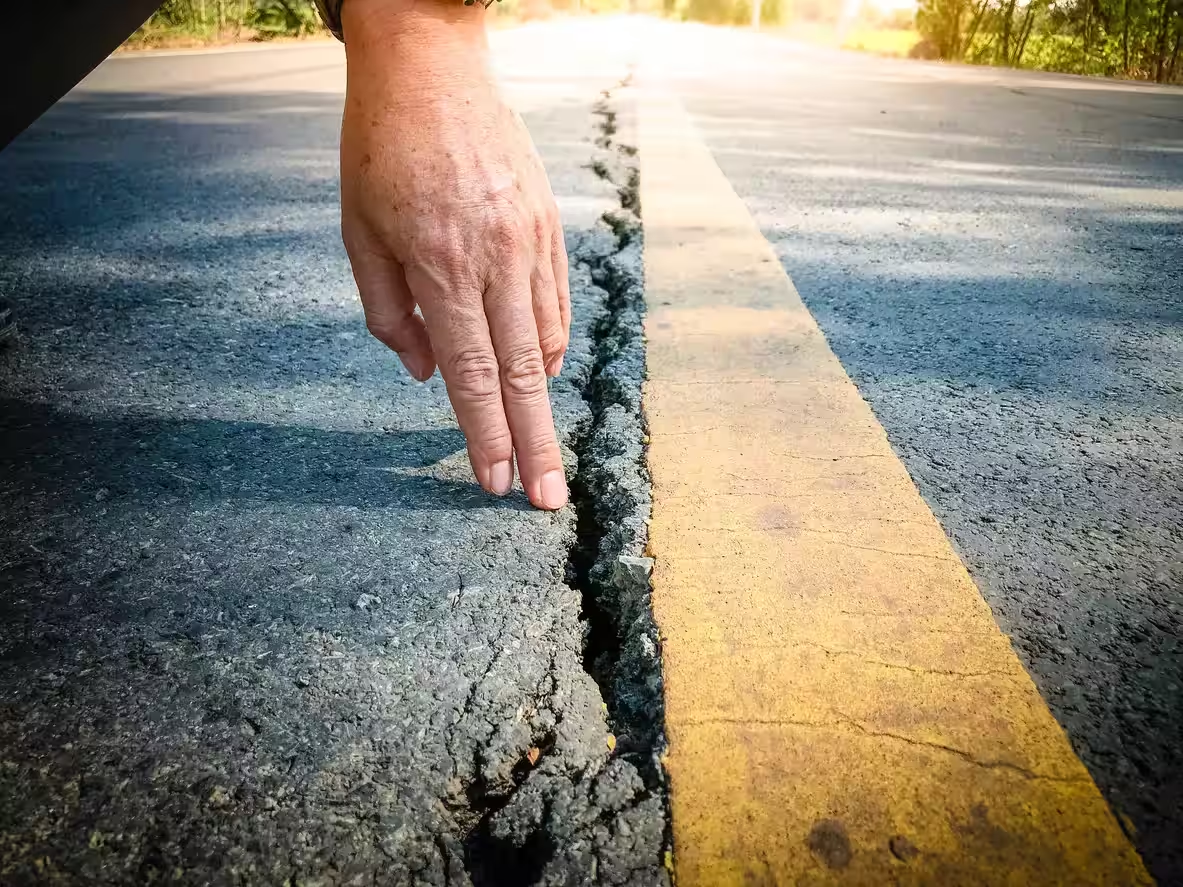
Discrete defects are captured as sudden jolts in the vehicle’s motion. A pothole or a sharp bump produces a distinct spike that stands out from normal driving. Catching these individually tells a fleet not just that a road is rough overall, but exactly where the worst hazards sit.
The Location of Every Defect
Each reading is captured with the location where it happened. A roughness score or a pothole is only useful if a fleet knows where it is, so every event is tagged to a point on the map. That location turns a raw signal into something a team can act on or report.
The Sensors That Capture It
Road surface data comes from a small set of sensors, led by the accelerometer and supported by gyroscope, GPS, and cameras. Most of these already exist in a telematics device, which is what makes fleet-wide capture practical.
| Sensor | What it captures |
|---|---|
| Accelerometer | Vertical motion, for roughness and jolts |
| Gyroscope | Rotational and bump patterns |
| GPS | The location of each reading |
| Camera / LiDAR | Visual and 3D detection of defects |
Accelerometers
The accelerometer is the core sensor, measuring the vertical acceleration the road forces on the vehicle. A smooth road produces gentle motion; a rough one produces sharp, frequent movement. Processing that vertical acceleration is how the system estimates roughness.
Gyroscopes
The gyroscope adds the rotational side of the motion. It captures the pitch and roll a vehicle makes when it hits a bump or drops into a hole, which helps separate a real pothole from ordinary vibration. Paired with the accelerometer, it makes pothole detection more reliable.
GPS
GPS ties every reading to a place. As the vehicle records roughness and jolts, GPS geotags each one so the data becomes a map rather than a list. This is what lets a fleet point to a specific pothole on a specific road.
Cameras and LiDAR
Cameras and LiDAR add a visual and 3D view where more detail is needed. A camera can confirm what the motion sensors flagged and see cracks that do not jolt the vehicle, while LiDAR builds a precise surface profile. These cost more and are usually reserved for detailed surveys rather than everyday capture.
How Raw Motion Becomes a Road-Quality Reading
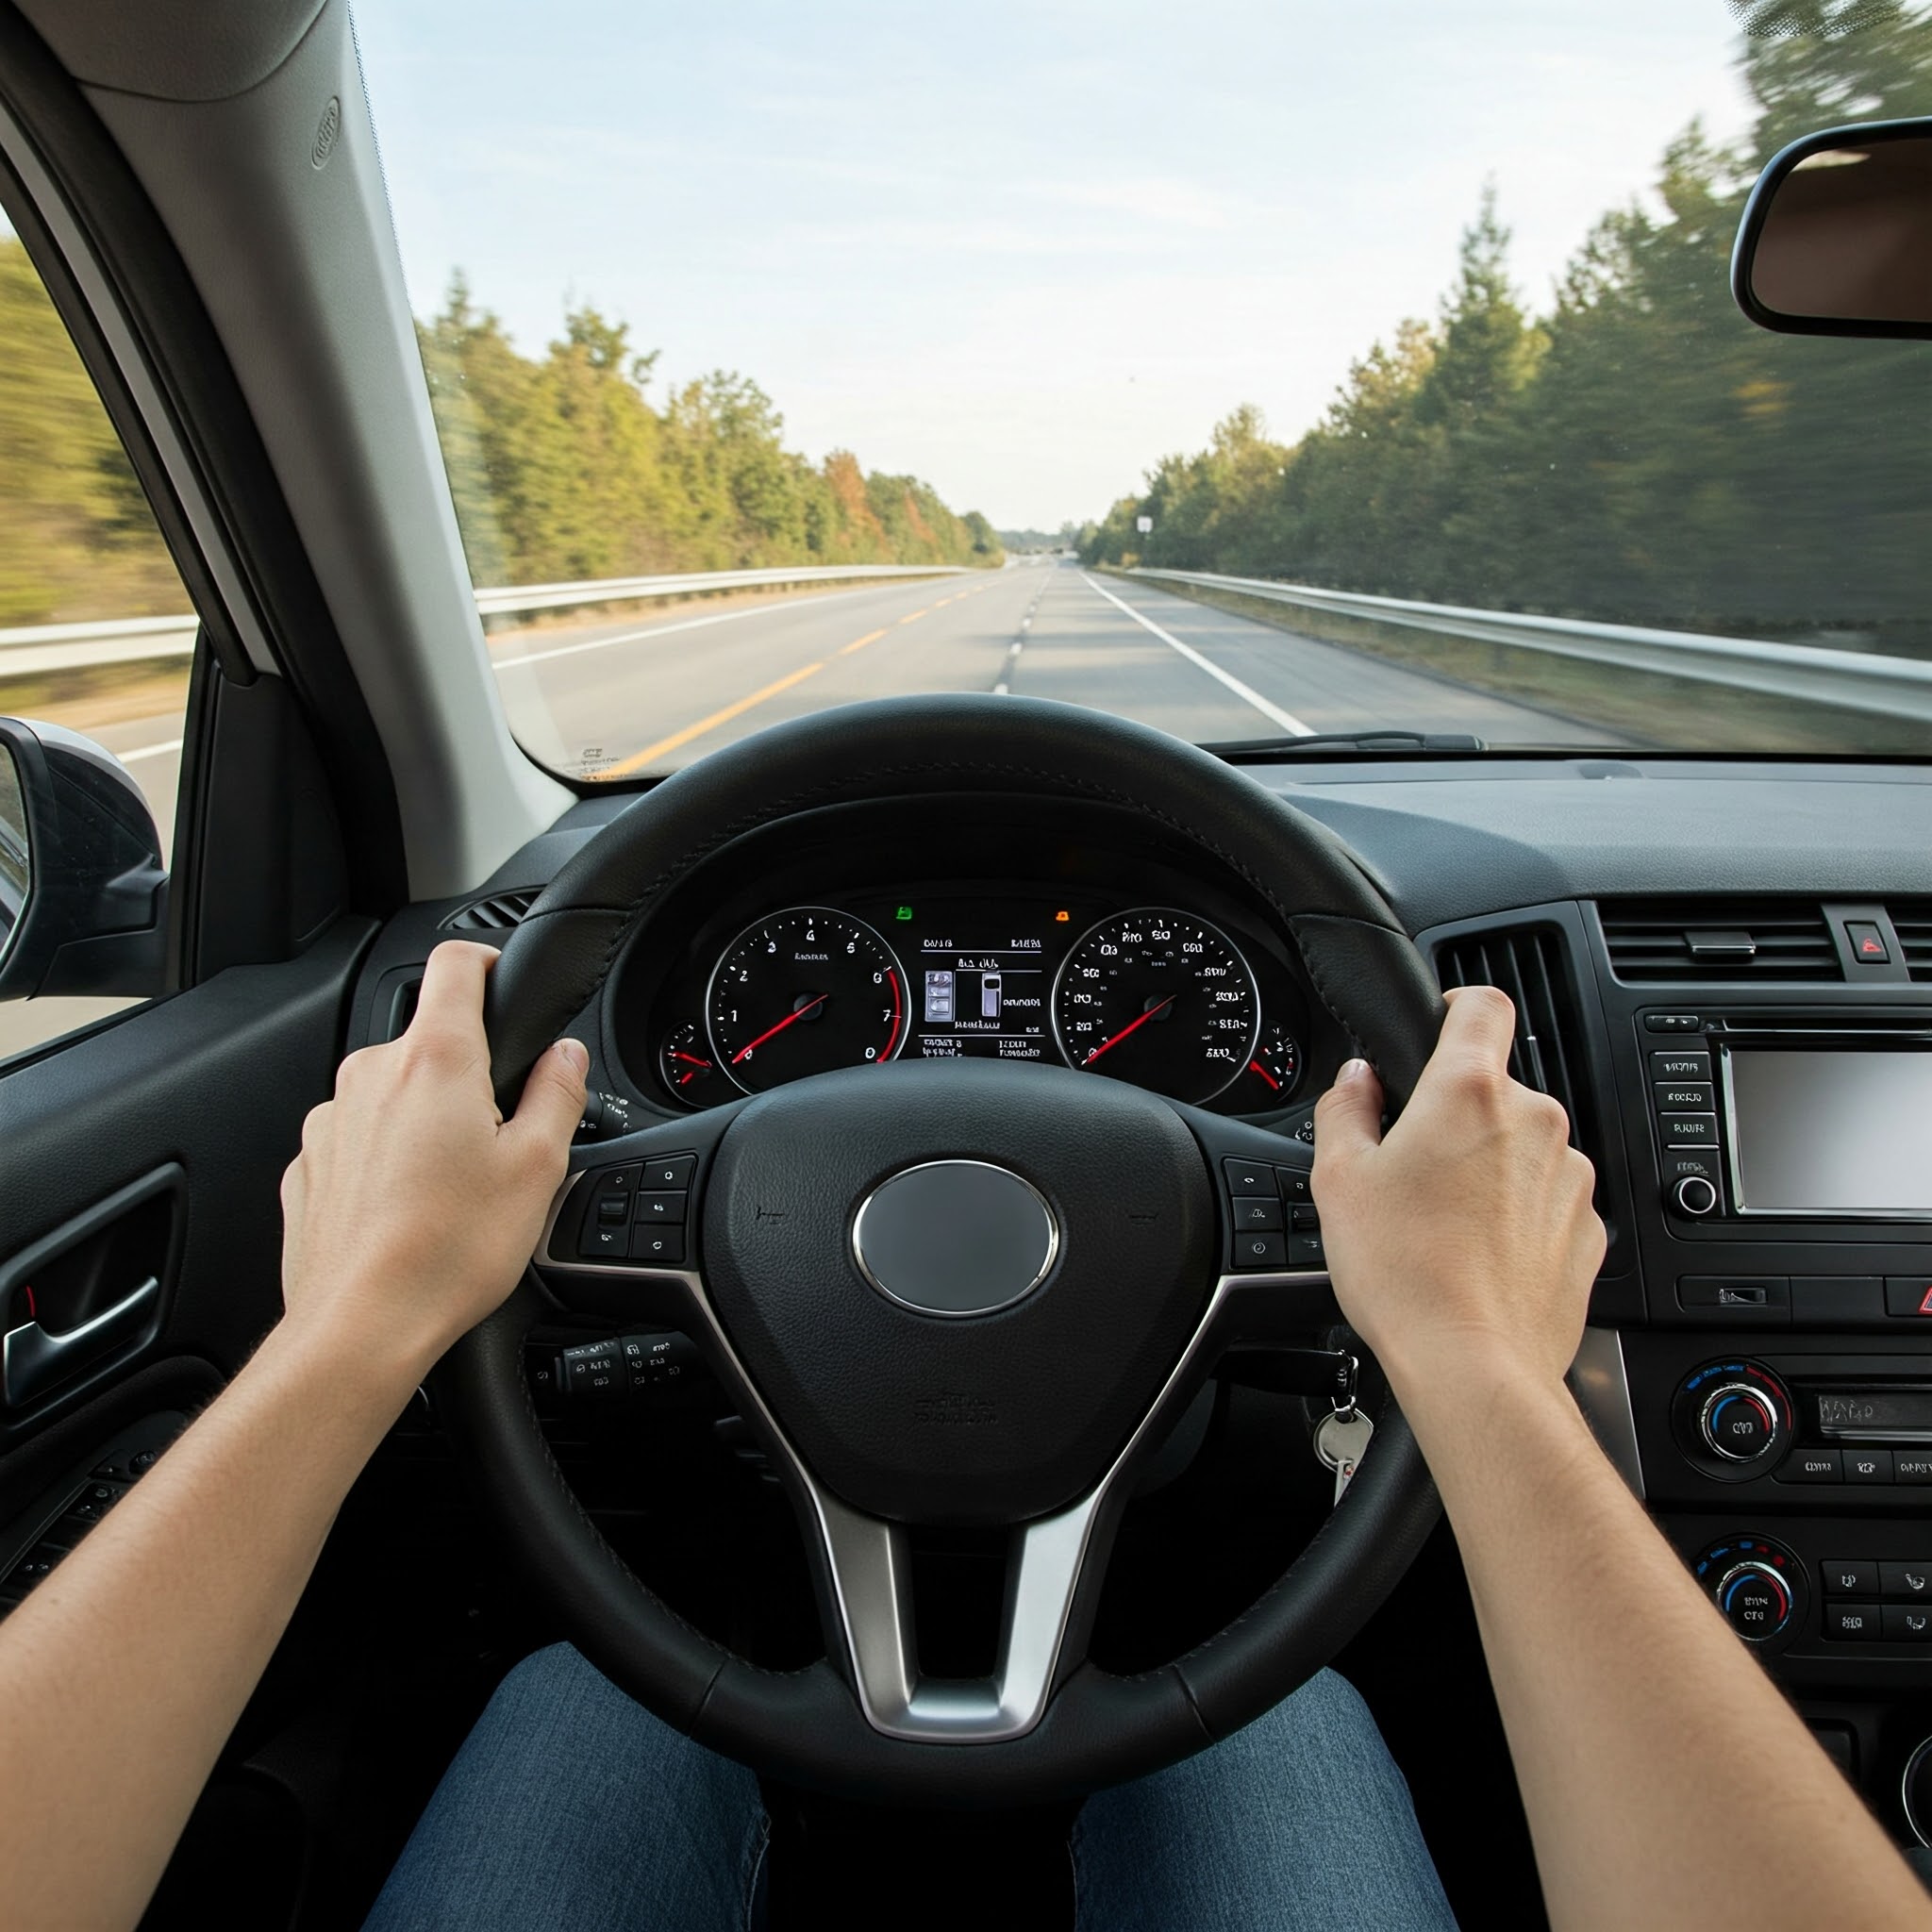
Raw sensor motion becomes a road-quality reading through signal processing followed by a model that scores roughness and flags defects. The vehicle’s shaking on its own is noisy; the value comes from cleaning it and interpreting it.
From Acceleration to IRI
Roughness is worked out by converting vertical acceleration into a roughness score, often through a simplified quarter-car model. The model treats the vehicle as a spring-and-damper system to estimate how much the road, rather than the vehicle itself, is responsible for the motion. The result is an IRI value for each segment.
Classifying Potholes With Machine Learning
Potholes are identified by feeding the cleaned accelerometer and gyroscope signals into a machine-learning classifier. After filtering and feature extraction, models such as support vector machines, random forests, and k-nearest neighbours decide whether a short window of data is a pothole or just normal driving. This separates real defects from harmless bumps.
Turning a Fleet Into a Road-Condition Network
A fleet becomes a road-condition network when many vehicles report their readings together into one place. One vehicle covers one route; a fleet covers a city, and the same road gets measured many times, which makes the picture more reliable.
This is the probe-vehicle idea: ordinary vehicles double as sensors, and their combined data builds a live map of road condition. A vehicle data capture platform aggregates the readings from every vehicle, tags them by location, and updates the map as new trips come in. The more the fleet drives, the fresher and more complete the road-condition data becomes.
What Fleets Do With Road Surface Data
Fleets use road surface data to protect their vehicles, plan maintenance, and support the wider road network. The same data serves several purposes at once.
Protecting Vehicles and Routing Around Rough Roads
A fleet uses the data to steer vehicles away from the roughest roads. Knowing which routes are punishing lets dispatch pick smoother paths, which reduces the wear and damage that rough surfaces cause. It protects both the vehicle and the cargo.
Linking Rough Roads to Vehicle Wear
The data helps explain why some vehicles wear faster than others. Vehicles that run constant rough routes take more suspension and tyre punishment, and connecting road roughness to that wear sharpens maintenance planning. It turns a vague sense of hard routes into evidence.
Reporting to Road Authorities and Smart-City Programs
A fleet can share its road-condition map with the authorities that fix the roads. Detailed, located data on potholes and rough stretches is valuable to municipalities and smart-city programs, and a fleet that already collects it can pass it on. This makes the fleet a contributor to safer roads for everyone.
What Affects Accuracy
The accuracy of the readings depends on the vehicle’s suspension, its speed, and where the sensor sits. The same road can produce different signals in different vehicles, so the data has to account for that.
A stiff or worn suspension changes how the road’s motion reaches the sensor, and different vehicle types vibrate differently. Speed matters too, since the same defect produces a different jolt at different speeds. Sensor placement and alignment also shape the signal, so a reliable system calibrates for the vehicle rather than assuming every reading is directly comparable.
Getting Started
A fleet starts by choosing sensors, placing them well, and aggregating the data into one platform. Beginning with the vehicles that cover the most ground gives the widest coverage fastest.
- Use the sensors already on board where possible, led by the accelerometer and GPS.
- Place and calibrate the sensor for each vehicle so readings are consistent.
- Aggregate every vehicle’s data into one platform tagged by location.
- Scale across the fleet to build a complete, current road-condition map.
Frequently Asked Questions
What sensors measure road surface quality from a vehicle?
The main sensors are an accelerometer, a gyroscope, and GPS, with cameras or LiDAR added for detail. The accelerometer reads vertical motion for roughness, the gyroscope catches bump patterns, and GPS tags the location. Most of these already sit in a telematics device.
What is the International Roughness Index (IRI)?
The IRI is a score of how rough a road is, based on the vertical movement measured along it. It is reported in metres per kilometre, and a lower value means a smoother road. It gives fleets and road authorities one consistent way to compare road condition.
How do vehicle sensors detect potholes?
Vehicle sensors detect potholes by reading the sudden jolt a hole causes and classifying it. Accelerometer and gyroscope signals are cleaned, then a machine-learning model decides whether the pattern is a pothole or normal driving. GPS records where it happened.
Can a normal fleet vehicle collect road condition data?
Yes, a normal vehicle can collect this data using the accelerometer and GPS already in its telematics device. No special survey equipment is needed for basic roughness and pothole detection. Cameras or LiDAR are only added when a fleet wants more detail.
What affects the accuracy of the readings?
Accuracy is affected by the vehicle’s suspension, its speed, and the sensor’s placement. Different vehicles vibrate differently, the same defect feels different at different speeds, and sensor position shifts the signal. A good system calibrates for each vehicle to keep readings comparable.